


Introduction
Here we present the analysis of some epitopes and sequences using EpiQuest-C and C-scanner. For details about settings of the programs please see its Manual. All the sequences are present in the Demo sequences (freely accessible in Demo mode).
EpiQuest-B | EpiQuest-A | EpiQuest-IM | EpiQuest-C |EpiQuest-T | EpiQuest-H | EpiQuest-M | In Charge | EpiStat
PCNA [Leishmania donovani]
Below we present an example of the complexity profile. The sequence for PCNA was analysed at standard settings (the upper image, T=0), and at a more stringent setting (T=1), which allows raising the threshold for the fragment to be considered as well-organised.

The results are presented by the program as a histogram reflecting the relative weight for each point of the sequence, as defined by the context, as well as the bar below indicating only the positive sequences.

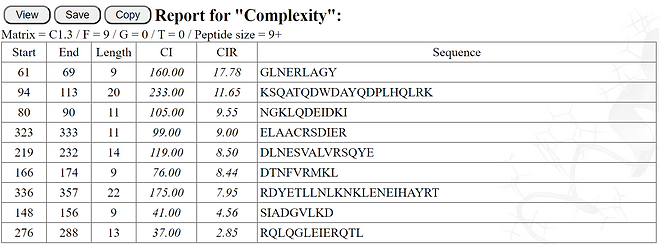
The program also produces a tabular report for all sequences that can be considered as positive (at the given cut-off level).
The data for every fragment reflects both cumulative complexity of the sequence (CI), as well as the complexity corrected for the sequence length (CIR- complexity index per residue). The table and bar reflect only the sequences longer than those defined in the Size setting (in the is case 9+, 9 and longer amino acids)
Keratin 18 [Xenopus laevis]
When profiling a sequence for its complexity, it is important to remember that the program, when using matrix C1.3 penalizes the homodimers, tri-mers etc. of amino acids that are present in the sequence. This is done for all amino acids except for Phe, Pro, Tyr and Trp. This improves the results for the program when looking for immunologically complex (and thus - unique) sequences. For some species (for example for low vertebrates in comparison the higher ones) this, as well as usage of less "organised"amino acids, may result in lower overall complexity score of the sequence as well as its particular domains.


The histogram profile, as well as the tabular results for Keratin 18 of Xenopus, show low presence of highly organised sequences (especially from the point of their immunological uniqueness) .
The data presented for the Default and more stringent (T=1) settings of the analysis.
Cadherin 1 [Xenopus laevis]
Another application of the EpiQuest-C program is to identify the structurally complex sequences bearing functional importance in the molecule. This may be important when you compare the sequences from related species or evolutionary changes in the sequence of the protein. Comparison of the functional domains, less susceptible for changes may present you with a quite different picture of the molecule's evolution.


Here we present the analysis of Cadherin-1 from Xenopus. You can see that the results presented identify more and less organised sequences within the sequence of the molecule (you can judge by their CI (showing the segments of highest overall complexity)) and CIR indexes (the latter shows the relative local complexity).
If you compare these with the homologous sequences of other cadheirns (not only E, but say, P, N, and others, you will finds that the l evolution of the domain, and relations of the sequences from different domains give you a picture quite different from the one obtained from comparison of the full length sequences).
Testing epitopes in C-Scanner

To compare the relative complexity of a number of sequences, or to isolate the fragments of highest complexity from a particular long fragment, you can use C-Scanner. C-scanner analyses the complexity of peptides (sequences) of given size. You can, for example, compare the complexity of the epitopes, isolated by different ways, from different regions of the molecule or from different proteins |(i.e. when you select the most specific antigenic determinant for your antibody assay or choosing the best epitopes to prepare a specific antibody).
The table below shows an example of the results for the relative complexity of the potentially antigenic peptides isolated by analysis in EpiQuest-B of the NS1 sequence of Dengue virus 2. As you can see, the peptide starting at amino acid 138 ("Code") has the highest CI for the best 9-mer, and likely will be the most specific epitope for detecting response to NS1 protein of DV2.

For more about analysis of sequence with C-Scanner, please refer to this program Operation Manual (also available on the server's page for the program.
EpiQuest Suite and site www.epiquest.co.uk belongs to Aptum Biologics Ltd.
EpiQuest® is a registered Trademark of Aptum Biologics Ltd.
© 2018, 2020, 2021 Aptum Biologics Ltd.
