


About EpiQuest-H
EpiQuest-H is a program that allows you to analyse the hydrophobicity of different regions in a protein sequence by simultaneously using several different algorithms for analysis (in contrast to standard programs of this kind that usually allow only one algorithm).
EpiQuest-B | EpiQuest-A | EpiQuest-IM | EpiQuest-C |EpiQuest-T | EpiQuest-H | EpiQuest-M | In Charge | EpiStat
Matrix & Algorithm
The same algorithm uses several different Matrices with amino-acid scale values. As some of the original scale values were prepared for hydrophobicity, and some for hydrophilic properties (all quite different in scale of the numbers), all of them were re-adjusted to approximately the same scale to provide comparable results from different matrices. The sources for the original ratios for amino acid hydrophobicity are the following:
# Matrix Authors Reference
HKD2 Kyte J., Doolittle R.F. J. Mol. Biol. 157:105-132(1982).
HWW2 White, S.H., and Wimley, W.C. Annual Review of Biophysics and Biomolecular Structure 28, 319–365.
HBB2 Bull H.B., Breese K. Arch. Biochem. Biophys. 161:665-670(1974).
HZZ2 Zhu, C., Gao, Y., Li, H. et al Proc Natl Acad Sci U S A 113, 12946–12951.
HHW2 Hopp T.P., Woods K.R. Proc. Natl. Acad. Sci. U.S.A. 78:3824-3828(1981).
HEW2 Eisenberg D., et al. J. Mol. Biol. 179:125-142(1984).
HZL2 Zhao, G., London E. Protein Sci. 15:1987-2001(2006).
Program output
The program allows you to run all 7 different profiles in one go, each data presented as a histogram or as a bar indicates the areas that are hydrophilic according to the particular matrix used:
EpiQuest-H,hydrophobicity plot,hydrophobicity of amino acids,protein hydrophobicity,hydrophilic proteins,hydrophobic core,transmembrane protein hydrophobic,integral membrane protein hydrophobic,membrane proteins hydrophobic hydrophilic,cell surface hydrophobicity,hydrophilic amino acids examples,surface hydrophobicity of proteins,hydrophobic cluster analysis,hydrophilic proteins examples,hydrophobic amino acids in water,hydrophobic pocket hemoglobin,protein surface hydrophobicity,hic protein,cytochrome c hydrophobic,keratin hydrophobic,hydrophobicity analysis,hydrophobic enzymes,bsa hydrophobic,hydrophobic essential amino acids,hydrophobic membrane proteins,hydrophobic cluster analysis server
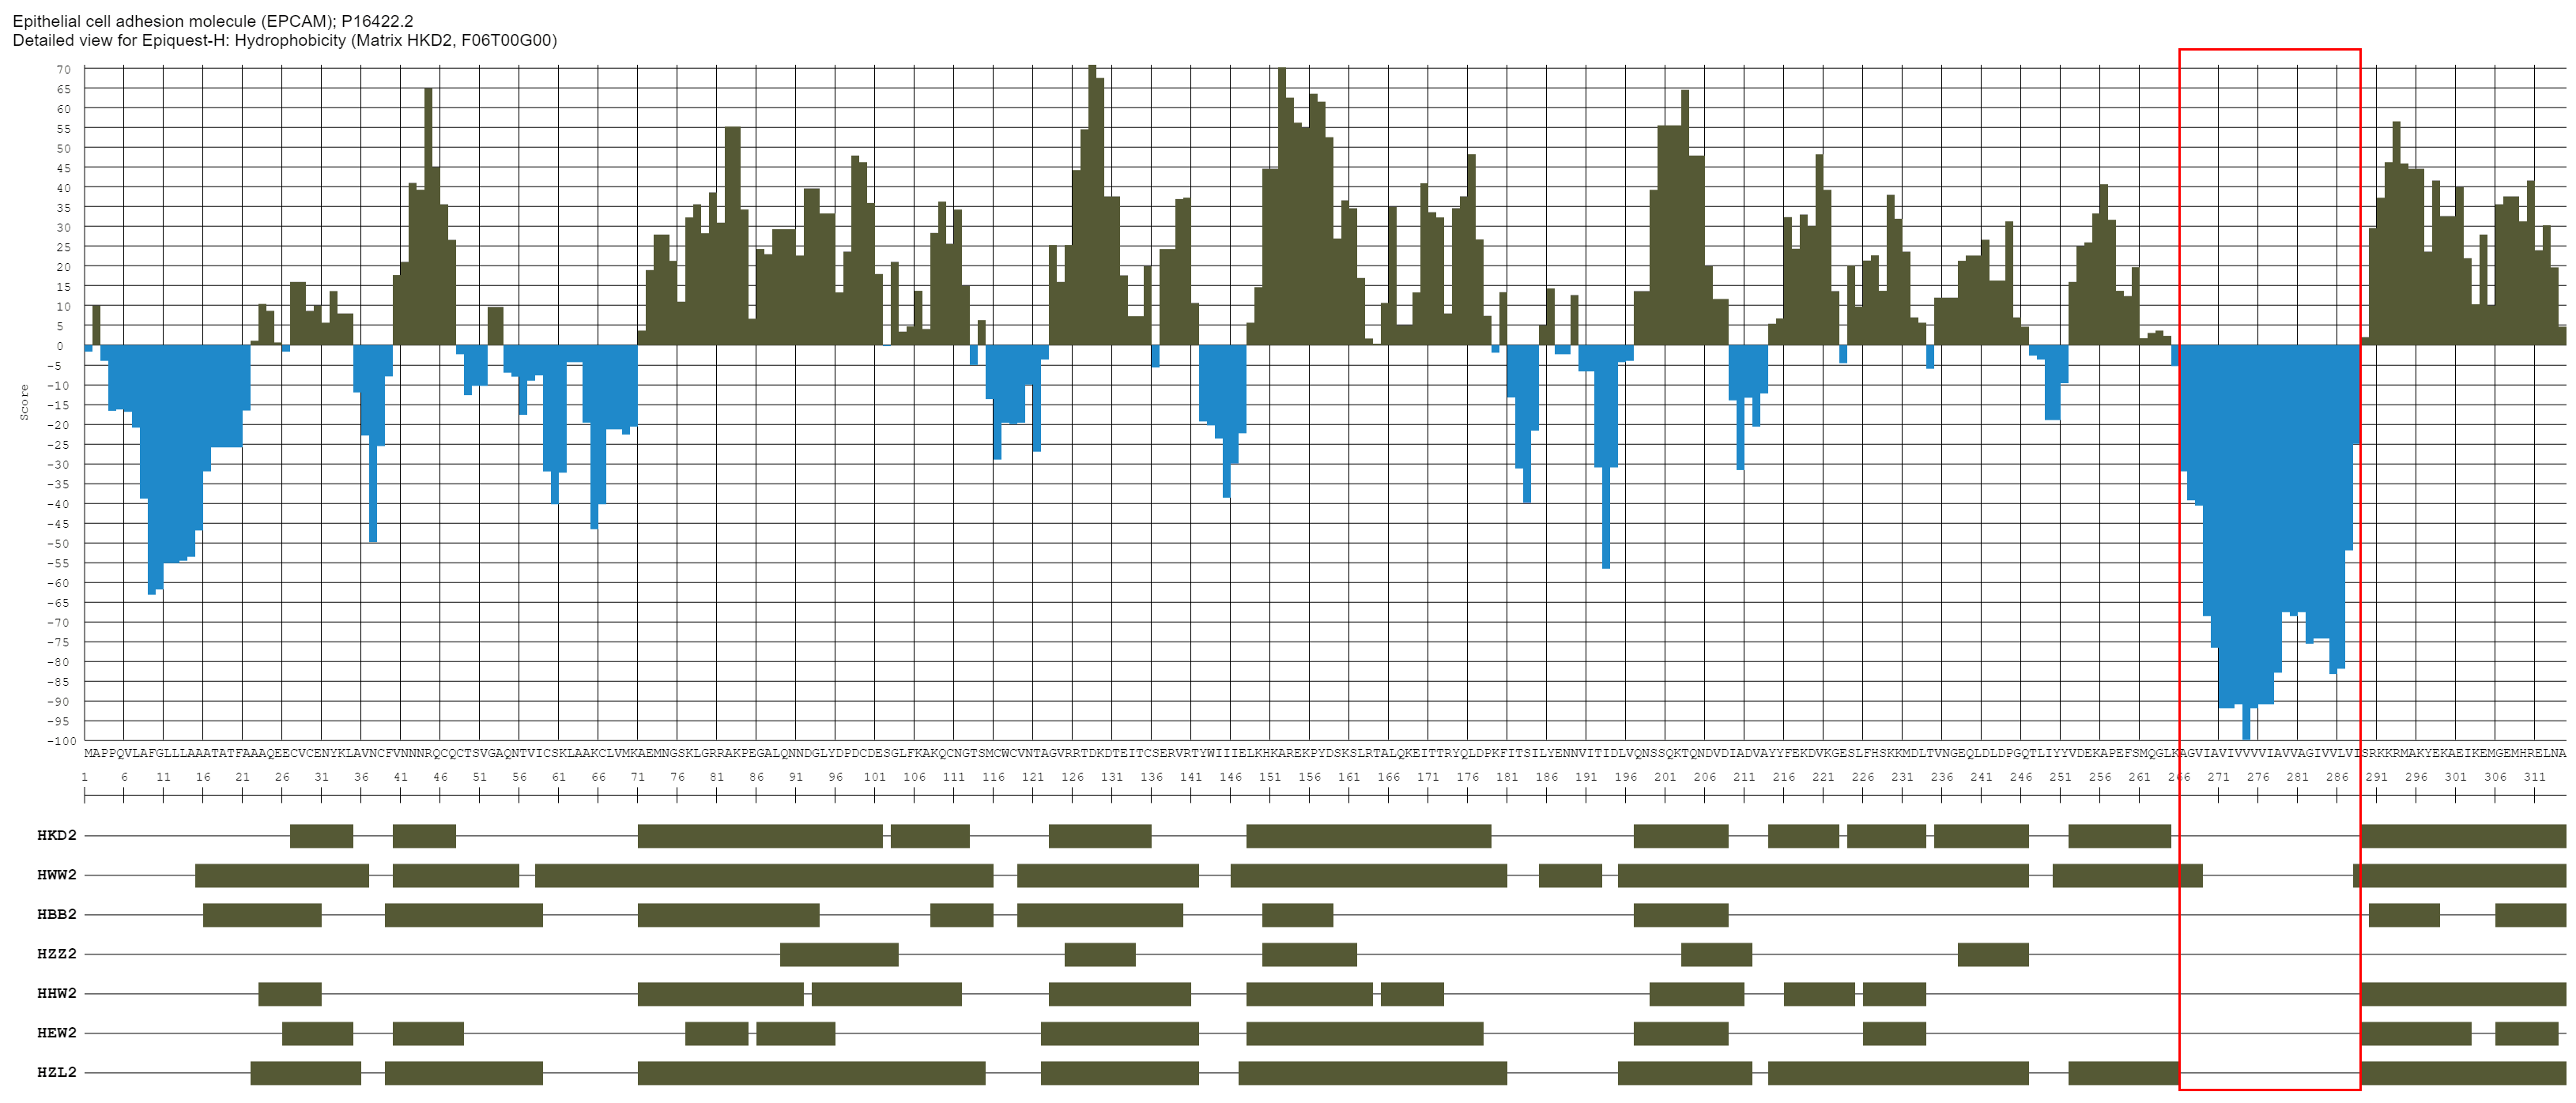
The image above shows the results of analysing for the hydrophobicity profile of EpCAM, a transmembrane molecule with a single transmembrane domain.You can see that the profile for this protein varies depending on the matrix used, although the TM domain is detected practically identically by all algorithms (the actual TM is marked by the red frame).When looking for the areas for a future antibody epitope we would advise to aim for single hydrophilic peak (in case this is a relevant issue for your analysis).
Hydrophobicity and Acessibility
It should be noted that Hydrophobicity does not correspond directly to Accessibility of the area at the surface of the folded protein molecule. Usually, the most hydrophilic areas are accessible (at the surface), while hydrophobic ones are not.
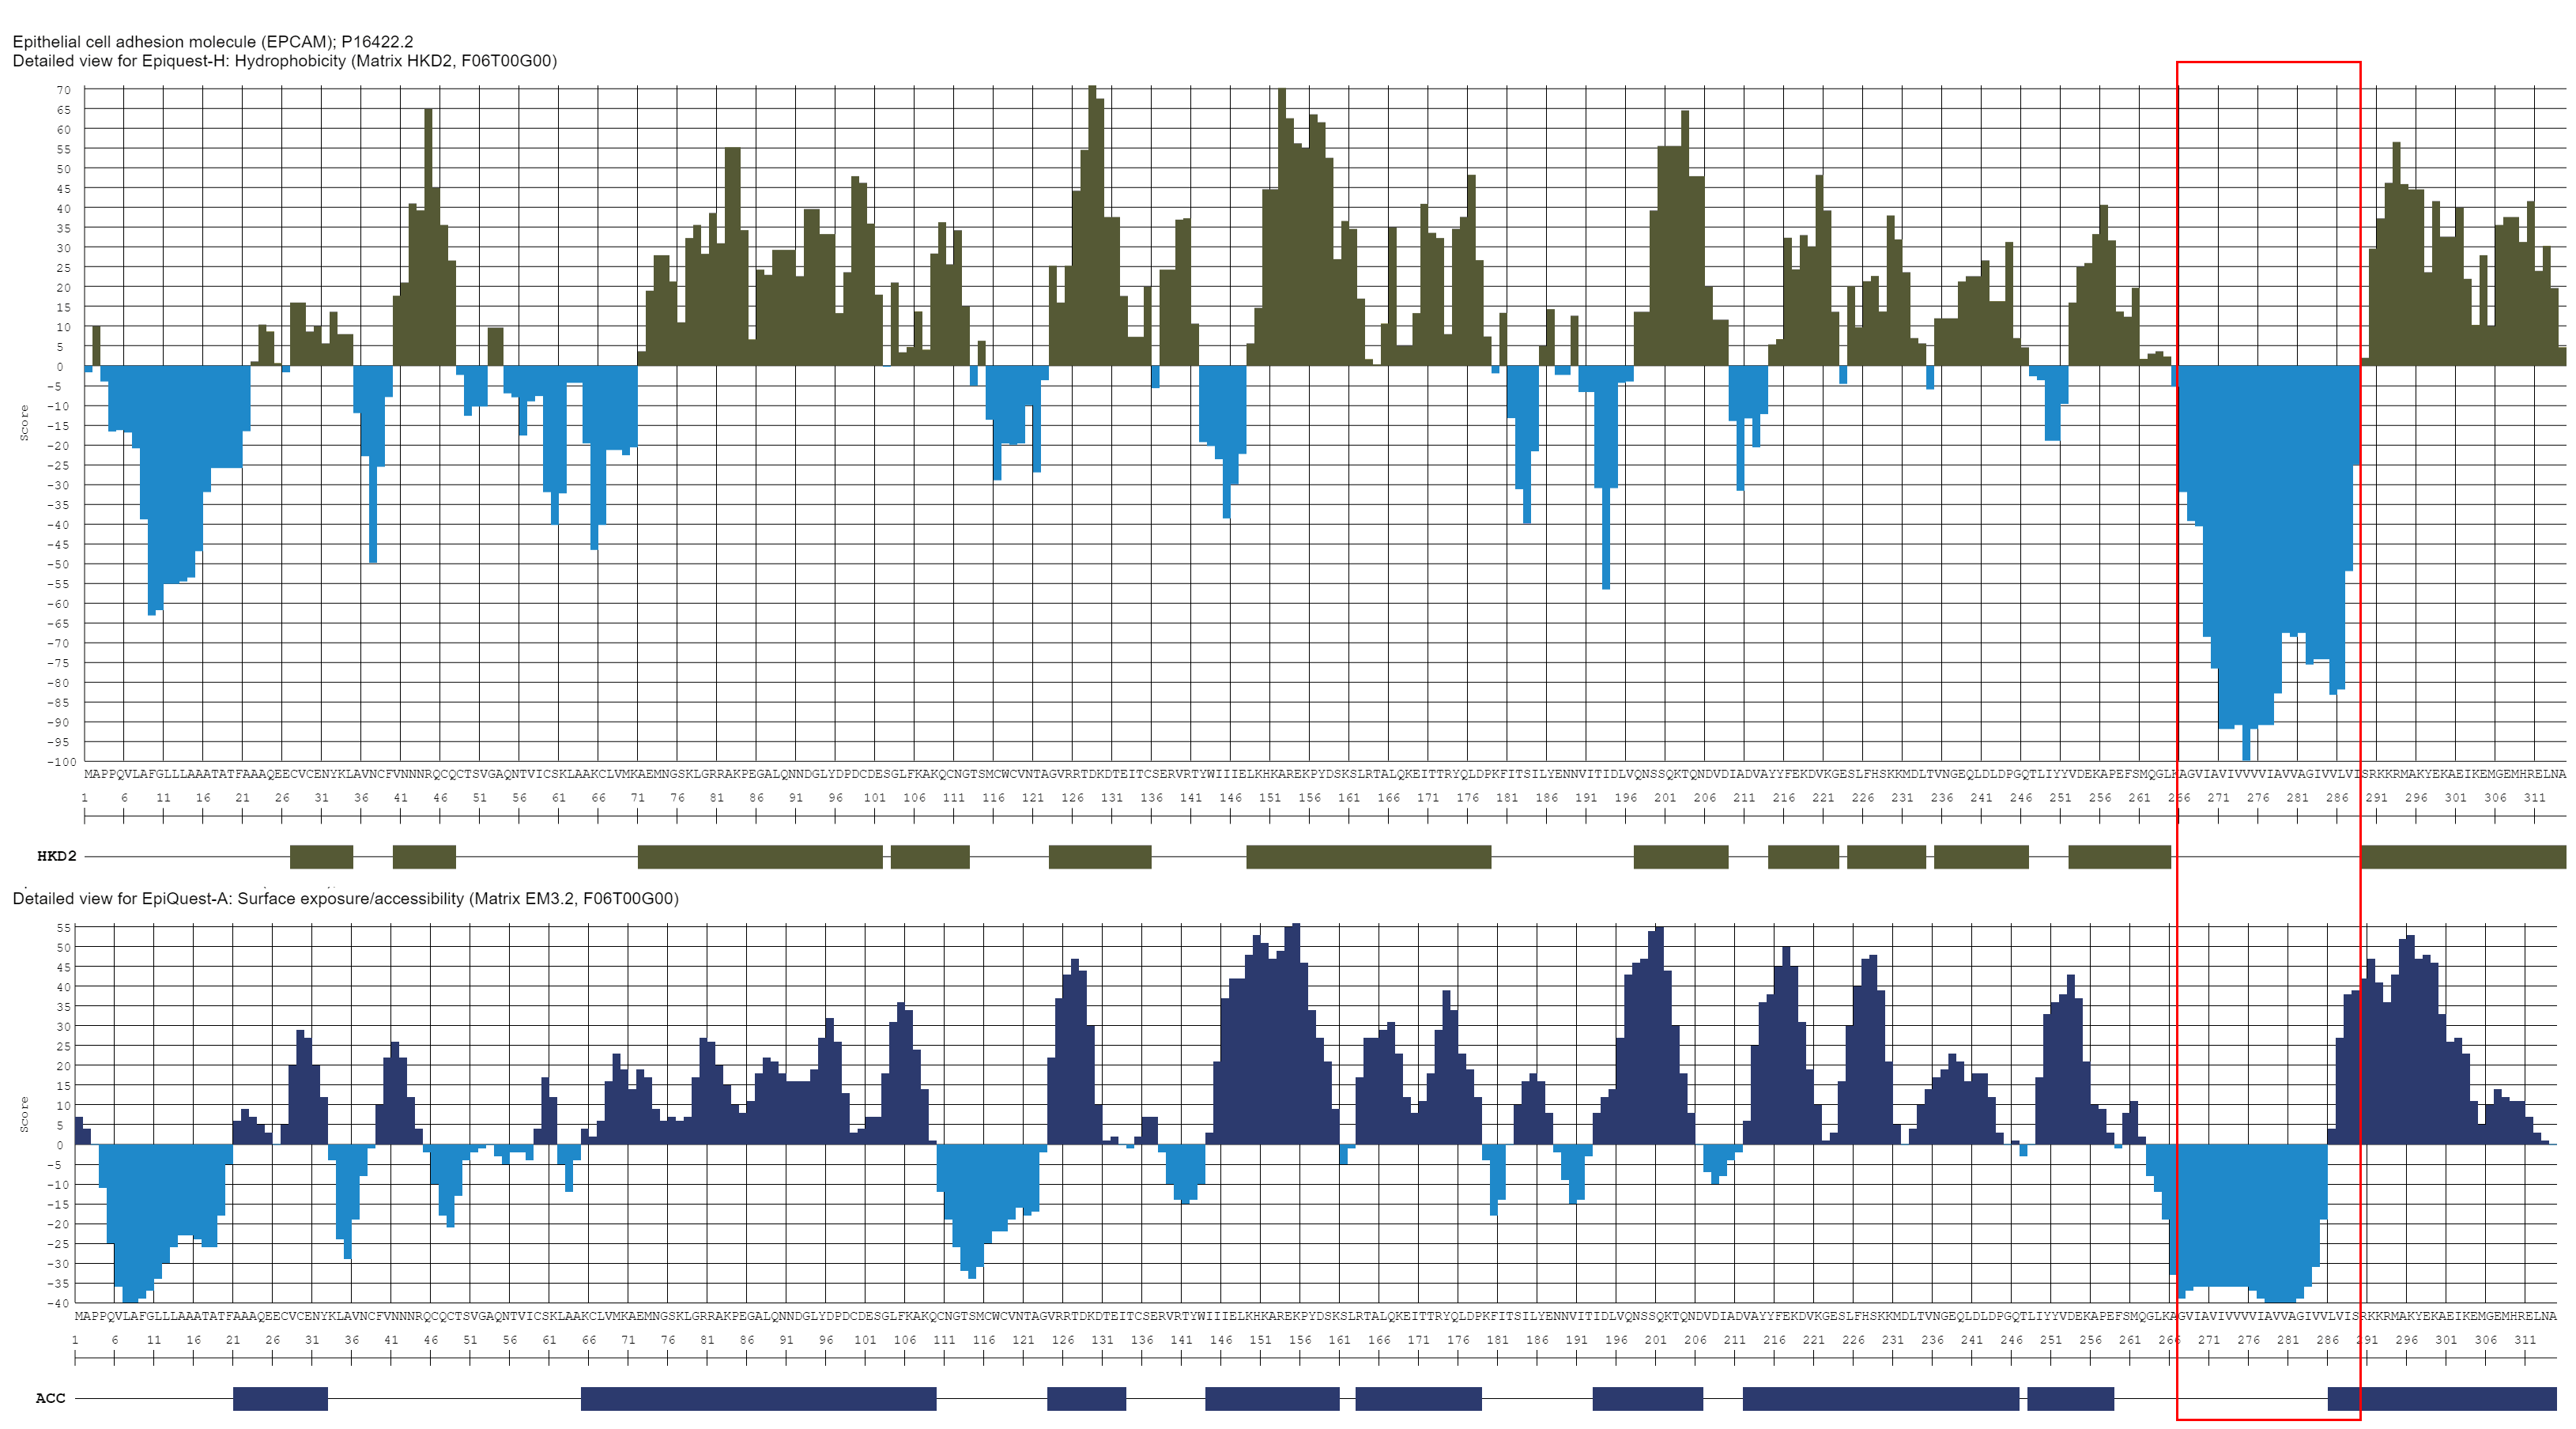
A hydrophobicity profile according to Kyte & Doolitle (above), when compared with accessibility profile (EpiQuest-A, below), shows that some hydrophilic areas are not necessarily the ones exposed at the surface of the protein, while some mildly hydrophobic may be accessible. Red frame indicates the transmembrane domain of the molecule, and while the C-terminal part of TM is not hydrophilic, it is likely fully accessible on a properly folded molecule.
Hydrophobicity and Antigenicity
There exists an old rule, in part originating from practical experience - if you are looking for a B-cell epitope to make an antibody, take the most hydrophilic fragment, and this will be a good epitope. With respect to accessibility of an epitope this is correct, however, there is no real correlation between the antigenic strength of an epitope and the sequence being hydrophilic.

Above is a map of antigenic (red), accessible (blue) and hydrophilic (green. Matrix HRD2) for NS1 protein of Dengue virus 2. All main peaks of Antigenicity maps correspond to actual immunodominant epitopes of this protein. As you can see, the first strong epitope of NS1 is not hydrophilic, and the second largest peak is hydrophilic only in part. Here you also can see how relationships are between hydrophilic and accessible areas, which overlap only partially.
Analysis of Demo Sequences
For a full overview of the program's capabilities you can use Demo Mode. The Manual for EpiQuest-H explains how to and modify settings. You can also see the examples of how to analyse the sequences and interpret the results by visiting the Demo Sequences analysis page.
EpiQuest Suite and site www.epiquest.co.uk belongs to Aptum Biologics Ltd.
EpiQuest® is a registered Trademark of Aptum Biologics Ltd.
© 2018, 2020, 2021 Aptum Biologics Ltd.
