


Introduction
Here we show the analysis of some test sequences and give some advice on how to interprete the obtained results, as well as how to vary the settings for the analysis.
EpiQuest-B | EpiQuest-A | EpiQuest-IM | EpiQuest-C |EpiQuest-T | EpiQuest-H | EpiQuest-M | In Charge | EpiStat
Epithelial cell adhesion molecule (EPCAM)
We show here the accessibility profile for EpCAM, a molecule with highly structured N-terminal art of the mature protein, and relatively straight the remaining part. The analysis was performed using Frame 3 (F=3) b F=6. The Frame defines the degree to which the context influences the score of the particular amino acid.
There are two important observations that may be done here:
- the N-terminal region, containing multiple cysteine bridges and loops, elicits many antibodies 3D epitopes, but none recognize linear epitopes. It is well suggested by the profile of the molecule at F=3, but not at F=6. Although F=6 is default setting, and is usually the optimal setting, you should choose for epitope good strong peaks, not the areas consisting form adjacent small peaks. It is also advisabel, as shown here, run the analysis using Frame=3 to check, whether some positive areas are not just several positive areas interrupted by the negative ones.
- as the adjacent areas (context) have impact on the value ascribed by the program to a particular position in the aminoacid sequence, the presernce of positive region may influence on the value of the neighboring sequences. You can see below that the transmembrane region of EpCAM (red frame) is more correctly detected at F=3 that at F=6.
'm a paragraph. Click here to add your own text and edit me. It’s easy. Just click “Edit Text” or double click me to add your own content and make changes to the font.

Images of accessibility profile for EpCAM molecule illustrating that the structure of the peaks it no less important that the cumulative value of non-interrupted positive sequence.
Tetraspanin-18 [Homo sapiens]
We present this analysis to illustrate that accessibility profile does not equal the hydrophobicily profile. It may overlap with it in some areas, but on the overall these are two different types of analysis, and hydrophililic region does not mean that sequences from it may be used for linear epitopes.
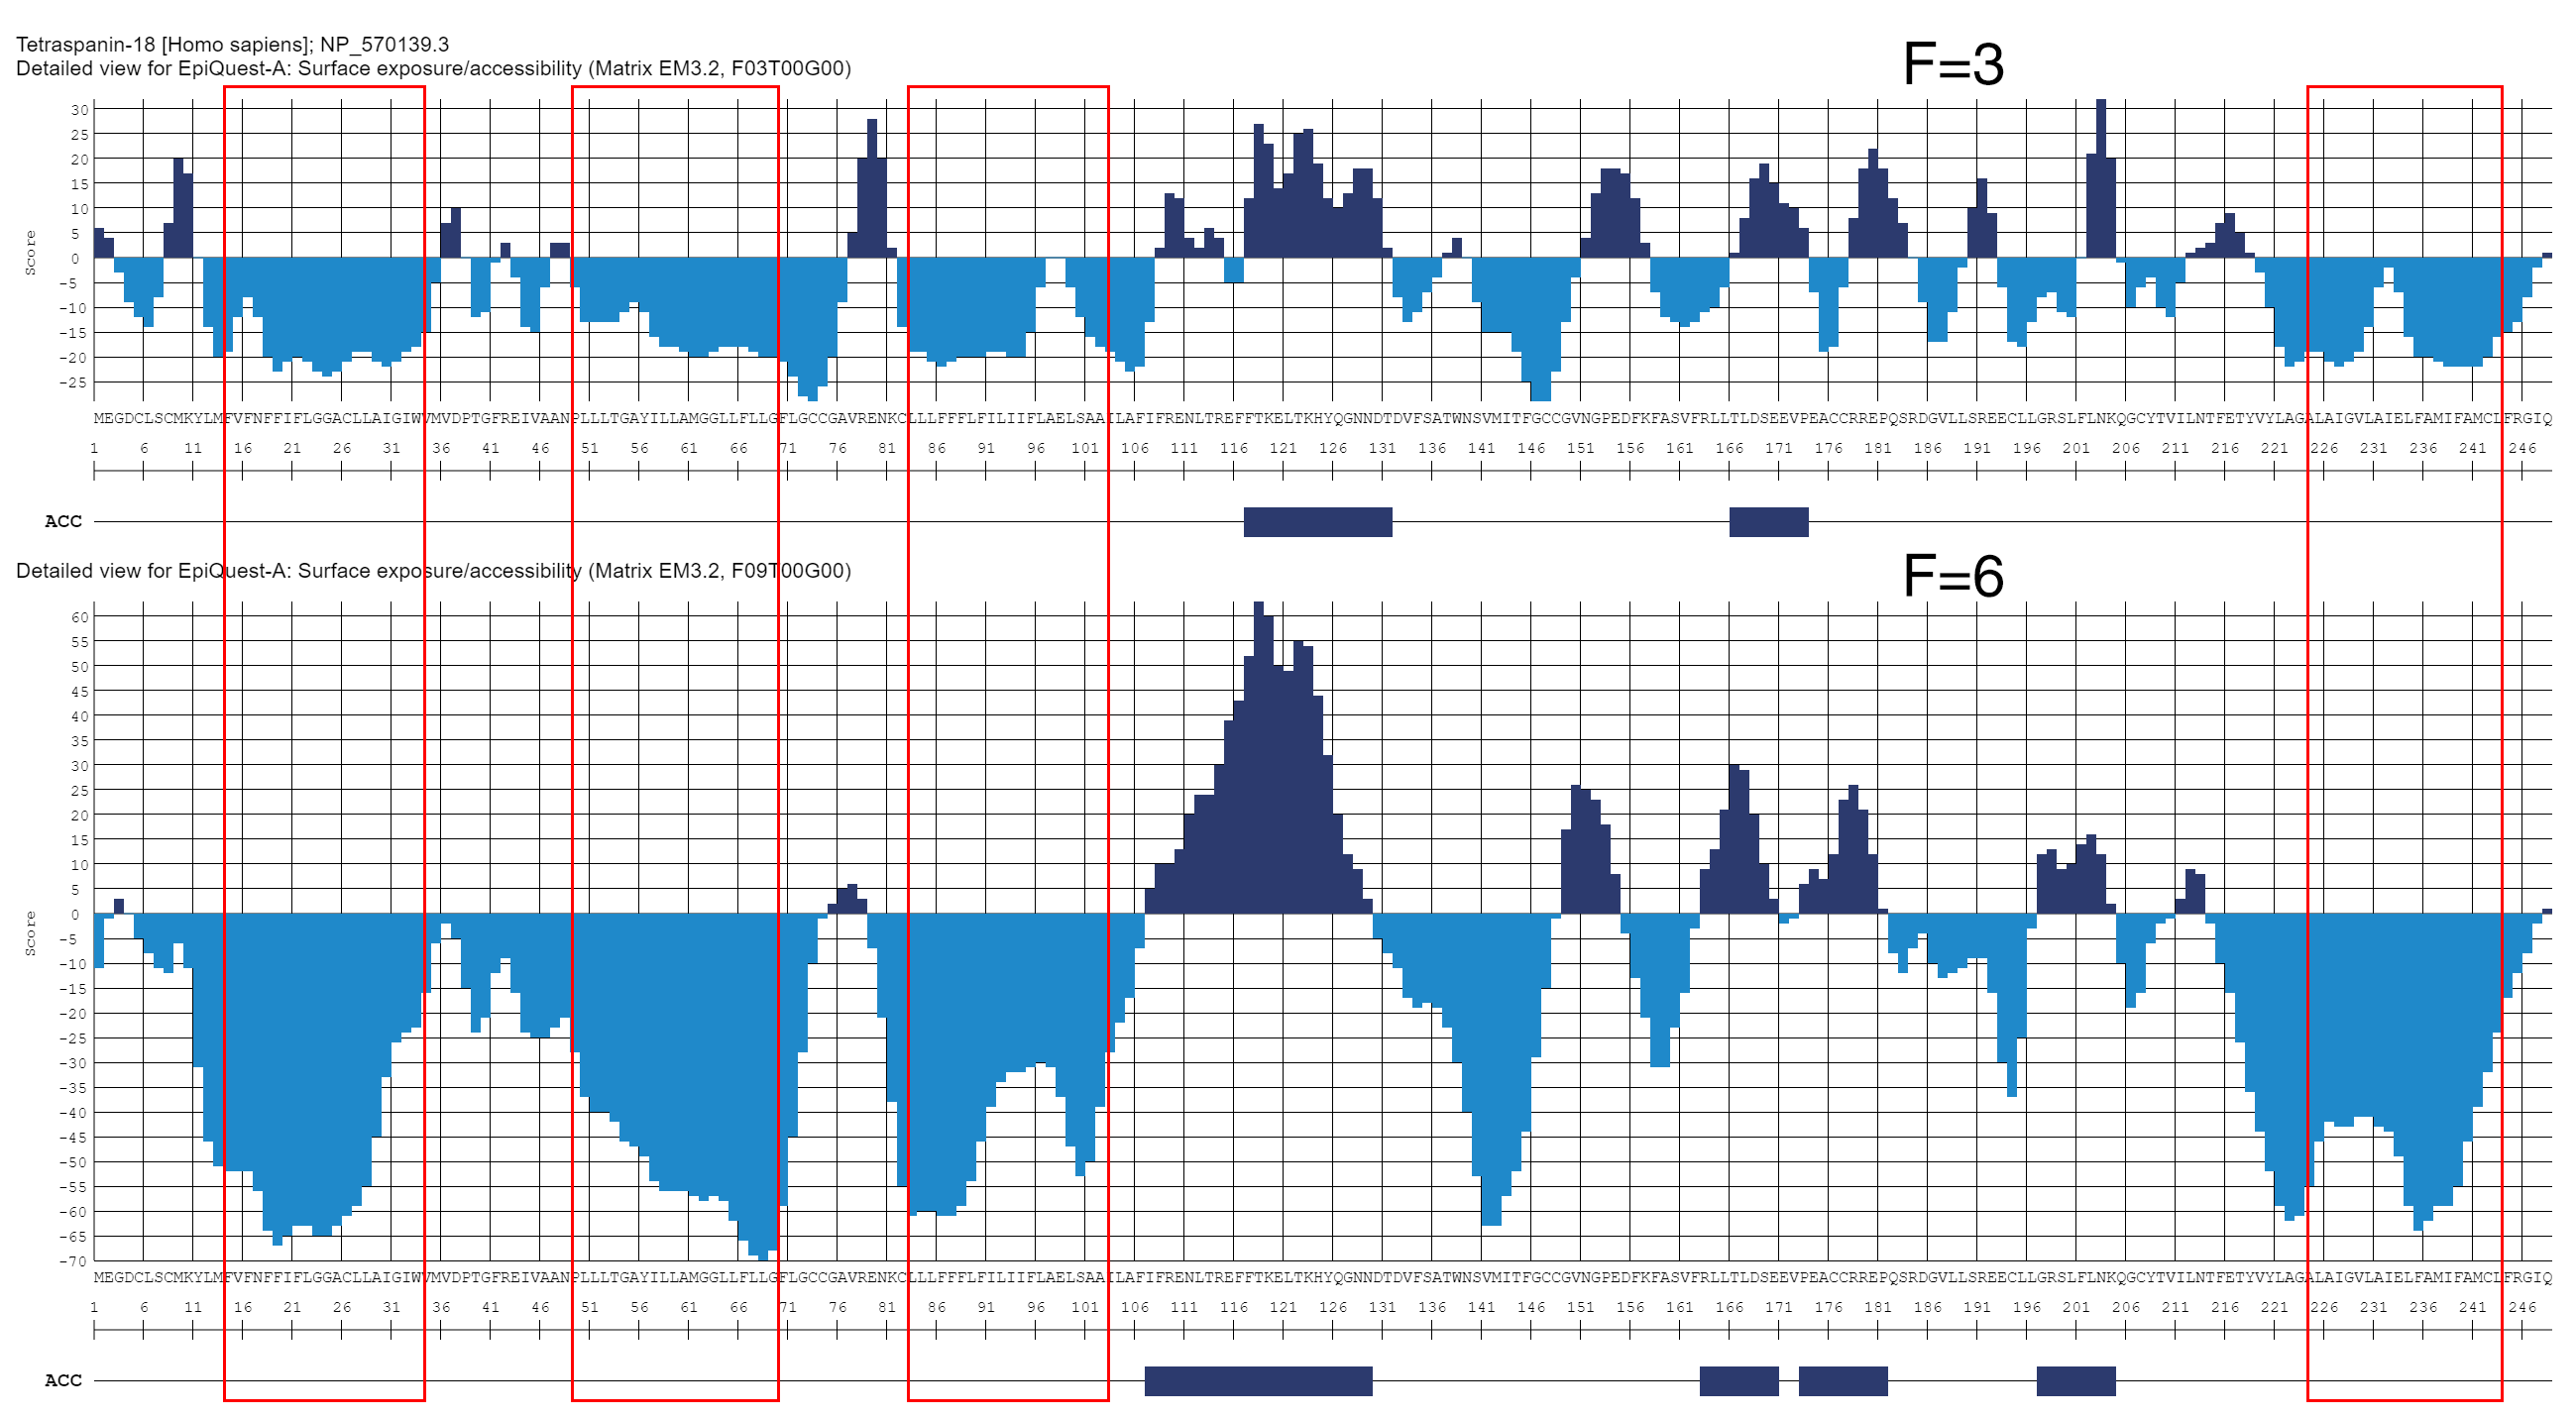
Tetraspanin-18 has 4 transmembrane domains (indicated here by red frames). As the analysis performed at F=3 and F=6 clearly indicates, in some proteins the areas outside the transmembrane domains may be quite inaccessible (defined by the structure of the native molecule). This also indicates that accessibility profile should not be used to predict the transmembrane domains or other hydrophobic structures.
Podoplanin [Homo sapiens]
It should be noted, that often poorly accessible domains of protein may be larger than, in example, transmemrabe domains or other areas that are obviously not well exposed at the surface of the molecule. Therefore, you should not rely to hydrophobicity profile of the protein when looking for proper accessible peptide epitopes. This subject is additionally discussed in page dedicated to EpiQuest-H.

In presented accessibility profile for podoplanin is is clear that poorly accessible areas are much wider including some additional sequences that are flanking the signal peptide and the transmembrane domain (indicated by the red frame)
EpiQuest® is a registered Trademark of Aptum Biologics Ltd.
© 2018, 2020, 2021 Aptum Biologics Ltd.

EpiQuest Suite and site www.epiquest.co.uk belongs to
Aptum Biologics Ltd.
1 Chilworth Drive, Southhampton, SO16 8AD Hampshire, United Kingdom
Tel. +44 (0) 7722 675 550
Fax. +44 (0) 23800 51061
E-mail info@aptum-bio.com